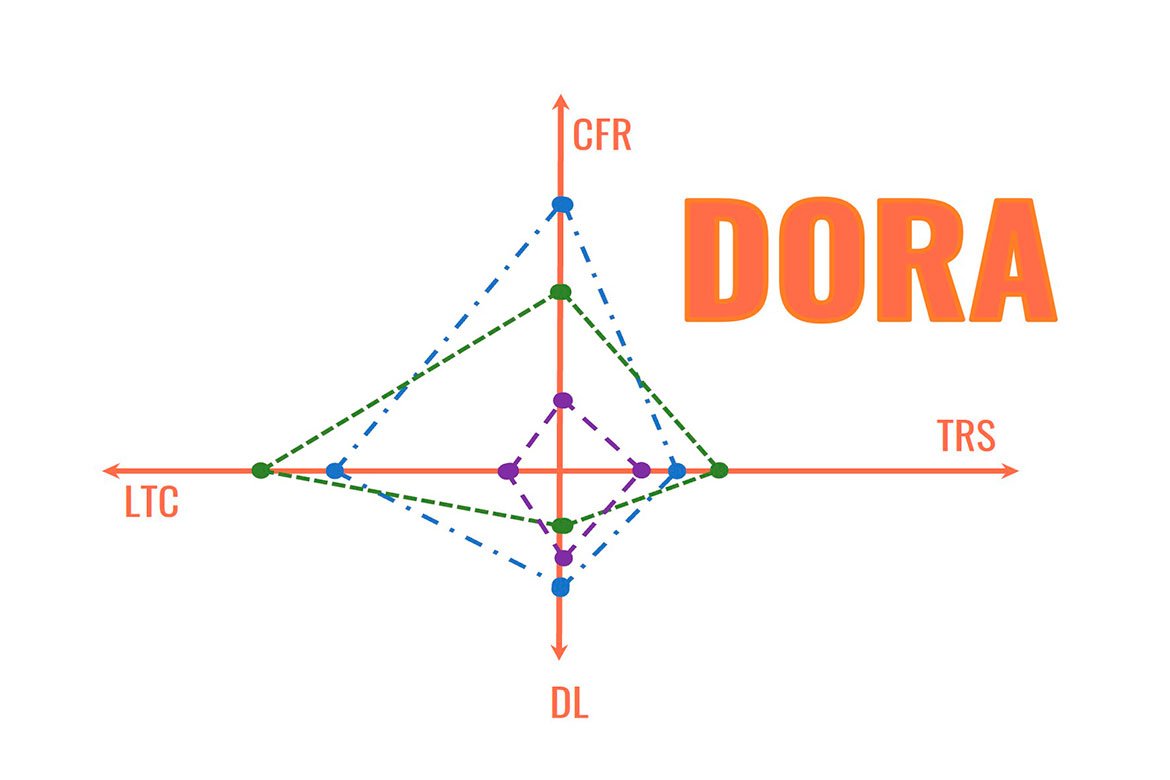
Embracing DORA Metrics
Many companies have successfully integrated DevOps practices into their engineering processes. In these organizations, teams are accountable not only for software development but also for how these applications are deployed and maintained. This embodies the DevOps principle of “You build it — you own it.”
Understanding DORA Metrics
The DevOps Research and Assessment (DORA) team at Google spent six years analyzing the state of DevOps in various organizations. They identified four key metrics as indicators of DevOps quality:
- Deployment Frequency (DF): This metric measures the rate of deployments. Ideally, with sufficient automated testing, teams are confident in their service and prepared to release every build that passes these tests. Frequent, fast deployments are preferred, though some teams might have different approaches like releasing once per sprint with a period of manual testing. Ranges can vary from multiple deployments per day (optimal) to monthly or slower (low performance). Optimal values demonstrate high agility and responsiveness in the development process.
- Lead Time for Changes (LTC): LTC measures the time elapsed from code commit to running in production. This metric considers the time it takes from developing a feature to deploying it in production. The journey from the initial commit to a merge request and finally to the master branch should be as short as possible. The optimal range is less than one day, indicating a highly efficient development pipeline. Times extending beyond one month are seen as less efficient.
- Change Failure Rate (CFR): This metric indicates the percentage of deployments that fail in production. Despite best efforts, errors can occur post-release due to differences between integration and production environments or overlooked edge cases. This metric reflects the percentage of deployments causing production issues, with a lower rate indicating better quality. An optimal CFR is low, typically between 0-15%, showcasing robust testing and quality assurance. A higher rate, especially above 45%, is a concern and suggests areas for improvement.
- Time to Restore Service (TRS): TRS assesses the time required to recover from a production failure. The likelihood of outages is always present, whether due to code or infrastructure issues. This metric measures the time needed to recover from a production error, with faster recovery times being ideal. The best-in-class organizations achieve restoration in less than an hour. A TRS longer than a day is considered suboptimal, pointing to issues in operational resilience and incident management.
Reasons to Use DORA
Regular measurement of these metrics allows teams to gauge and monitor their DevOps maturity level.
Enhanced Feedback and Continuous Improvement. By providing a quantitative framework, DORA metrics enable monitoring the health and efficiency of software development and deployment processes, leading to targeted improvements.
Predictability and Risk Management. These metrics offer insights into the stability and predictability of the deployment pipeline, aiding in better risk management and planning.
Fostering Collaboration. DORA metrics align developers, operations, and other stakeholders around common goals, breaking down silos and fostering a more integrated approach to software delivery.
Transparency and Accountability. Offering clear, objective data, DORA metrics enhance transparency and accountability, facilitating informed decision-making at both the management and team levels.
How to measure DORA
Google suggests using an ETL job to extract, process, and record metrics from a comprehensive source. This approach, while effective, raises questions about the source’s availability and the maintenance of the ETL job.
Using an Alternative Way
- Deployment Frequency and Lead Time for Changes: Tools like GitLab can monitor these metrics with minimal configuration.
- Time to Restore Service: Measured using internal status pages where services report disruptions and recovery.
- Change Failure Rate: Monitored using tools like NewRelic. An heuristic algorithm might assume, for example, that a failure within 30 minutes post-deployment is likely caused by the deployment, though false positives are possible.
Summary
While DORA metrics are invaluable in optimizing delivery processes, it’s important to note that they primarily assess the phase post-development. They do not encompass the full value delivery flow, which begins with value creation requests and culminates in customers interacting with the delivered value. Therefore, while DORA metrics provide critical insights into the efficiency and effectiveness of the development and deployment stages, they do not reflect the entirety of the delivery pipeline. This understanding is crucial for managers and developers to contextualize the role of these metrics within the broader scope of DevOps practices.
Making decisions based on factual, numeric data is crucial in DevOps. DORA metrics are an excellent starting point in the world of DevOps metrics. They are understandable and typically straightforward to implement. Once integrated, they provide a means to monitor the quality of DevOps practices within a team or organization, helping to ensure continual improvement and efficiency.

